Projections
Climate models can reproduce events ("hindcast") from 1900 - 2012 reasonably accurately, and they can be left to run on, happily continuing to generate temperature trends depending on the forcings and feed-backs programmed into them. There is a spread of projections depending on climate sensitivity and other inputs, but the broad trend is upwards.
On the other hand, some contrarians predict cooling, which they usually ascribe to waning solar activity. They do this without using models, because contrarians regard modelling as the work of the Devil.
It is impossible accurately to predict the future, but models are less inaccurate than simple theories, guesses and hunches. Models work on what they are given.
So are we giving models the right information about the future state of our planet?
Hindcasting models can be "instructed" exactly when volcanoes, ENSO, and other events took place. Projections cannot know when they will occur. However, they can be given rough outlines, based on past averages. Volcanoes can be delivered at intervals, and ocean current cycles (predominantly ENSO, for climate change purposes) can be roughly estimated. Since they vary in both directions, the difference between what the models are given and the actual out-turn will not be too great.
Here we will look first at ocean current cycles, and then at solar cycles.
The Ocean Current Component
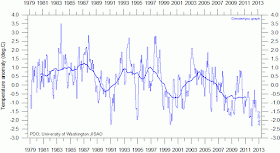
What can we expect the Pacific Decadal Oscillation (PDO, the el Nino/la Nina cycle) to do in the coming years?
Fig 1
This figure shows that the PDO has been in a cooling phase since 2004. It has been cool for longer than the last two cycles. It is not likely to warm up in 2013, because a warming is usually indicated in the Southern Spring (i.e. now), but it is inevitably going to enter a warming phase, probably in the next 2-3 years. The warm phase may lasts for three to six years.
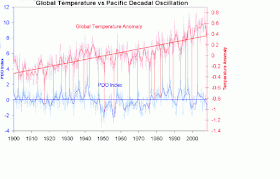
PDO is strongly correlated with global temperature. Here it is since 1900. The vertical lines have been added by me:
Fig 2
Are there other cycles that might affect the projections?
The temperature record shows a fluctuation on an approximate 60-70 year cycle:
Fig 3
Note the peaks in 1875, 1945 and 2000.This fluctuation agrees well with the global sea surface temperature (SST):
Fig 5
We can conclude that cycles of ocean currents have a noticeable effect on the global temperature, and therefore it is good that they are built into state of the art models. The state of cycles at the moment indicate that they are in a cooling phase at present, which may hold down temperature increases for another year or two before the upward trend resumes.
The Solar Component
Sunspot cycles correlate only weakly with global climate.
Fig 6
Note also that the temperature trends part company with post 1975 solar trends:
Fig 7
Loehle and Scafetta have posited a 60 year cycle, but their notion has been comprehensively dismantled.
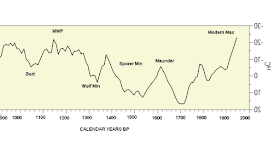
Suess and de Vries have posited a 200 year solar cycle. Here is a graph of solar activity as measured by carbon-14 over the last 1100 years. The peaks are very roughly 200 years apart, and we may well be due for another decline, and the present weakening of the sunspot cycle could even be the beginning of a downturn.
Fig 8
What kind of a drop in global temperatures could we expect that to produce? I have squashed together the above solar trace with a composite of temperatures here, with, as usual, apologies for the horrendously crude methodology. With the eye of faith, you can see movements in temperature that correlate with variations in solar activity.
Fig 9
How much does this solar variation represent? Using the composite of past temperatures below, (Fig 9) I measured (crudely, with a ruler, pencil and paper) falls and rises of 0.1*C for each of the falls of solar activity from 1120-1300, 1380-1460, and from 1600-1700.
On the other hand, the period of rise of solar activity from 1700 - 2000 shows a rise of 1.1*C, which suggests that it is amplified by another, non-solar factor.
Fig 10
Schindler et al. 2001 find a global change of 0.3-0.4*C in relation to the Maunder Minimum.
From this we can reasonably infer that if we are about to experience a fall in solar activity on the scale of the Maunder Minimum, we may expect a fall in solar component of forcing in the region of 0.1 - 0.4*C over the next 80-100 years. Which is good news, and something devoutly to be hoped for. Unfortunately, this cooling component is much weaker than the warming that we force on the planet by releasing stored carbon. Over the next century, we can count on a rise of 1.1*C due to CO2 doubling, and this will be amplified to 1.5 - 2*C in the belief of the more sensible luke-warmers, and anything from 3*C to 5+*C in the view of the vast majority of professional climate scientists.
So a Maunder Minimum is not going to save our sorry asses.
The only natural cycle that will turn down the heat in the long term is another turn of the Milankovitch cycle, but I am going to stop now and have a little lie down. I expect you could do with one of those too. There is no hurry, as Milankovitch cycles are counted in tens and hundreds of thousands of years.
Health Warning: I am not a climate scientist. This post makes no claim to scientific accuracy or status. It is climatology-in-a-bucket. I am trying to understand what is going on, trying to counterbalance misleading claims of the climate contrarians, and I am sharing my fumblings after truth with you. That is all.
More posts about modelling on this blog:
Model-free climate sensitivity is still dangerous
"Data" does not necessarily prove the models wrong
Climate models - are they scientific and reliable?


No comments:
Post a Comment